Australian Workplace Fatalities:
Overall Decline Masks Sector-Specific Rises
Australia's workplace fatality rate has fallen from 2.76 per 100,000 workers in 2003 to 1.30 in 2025, but the improvement is not evenly distributed. Transport and warehousing recorded the highest sector count in 2024, agriculture the highest fatality rate at 13.72 per 100,000 workers, and vehicle incidents the largest cause category at 79 deaths. The headline trend is real, but the detailed data shows where risk remains concentrated.
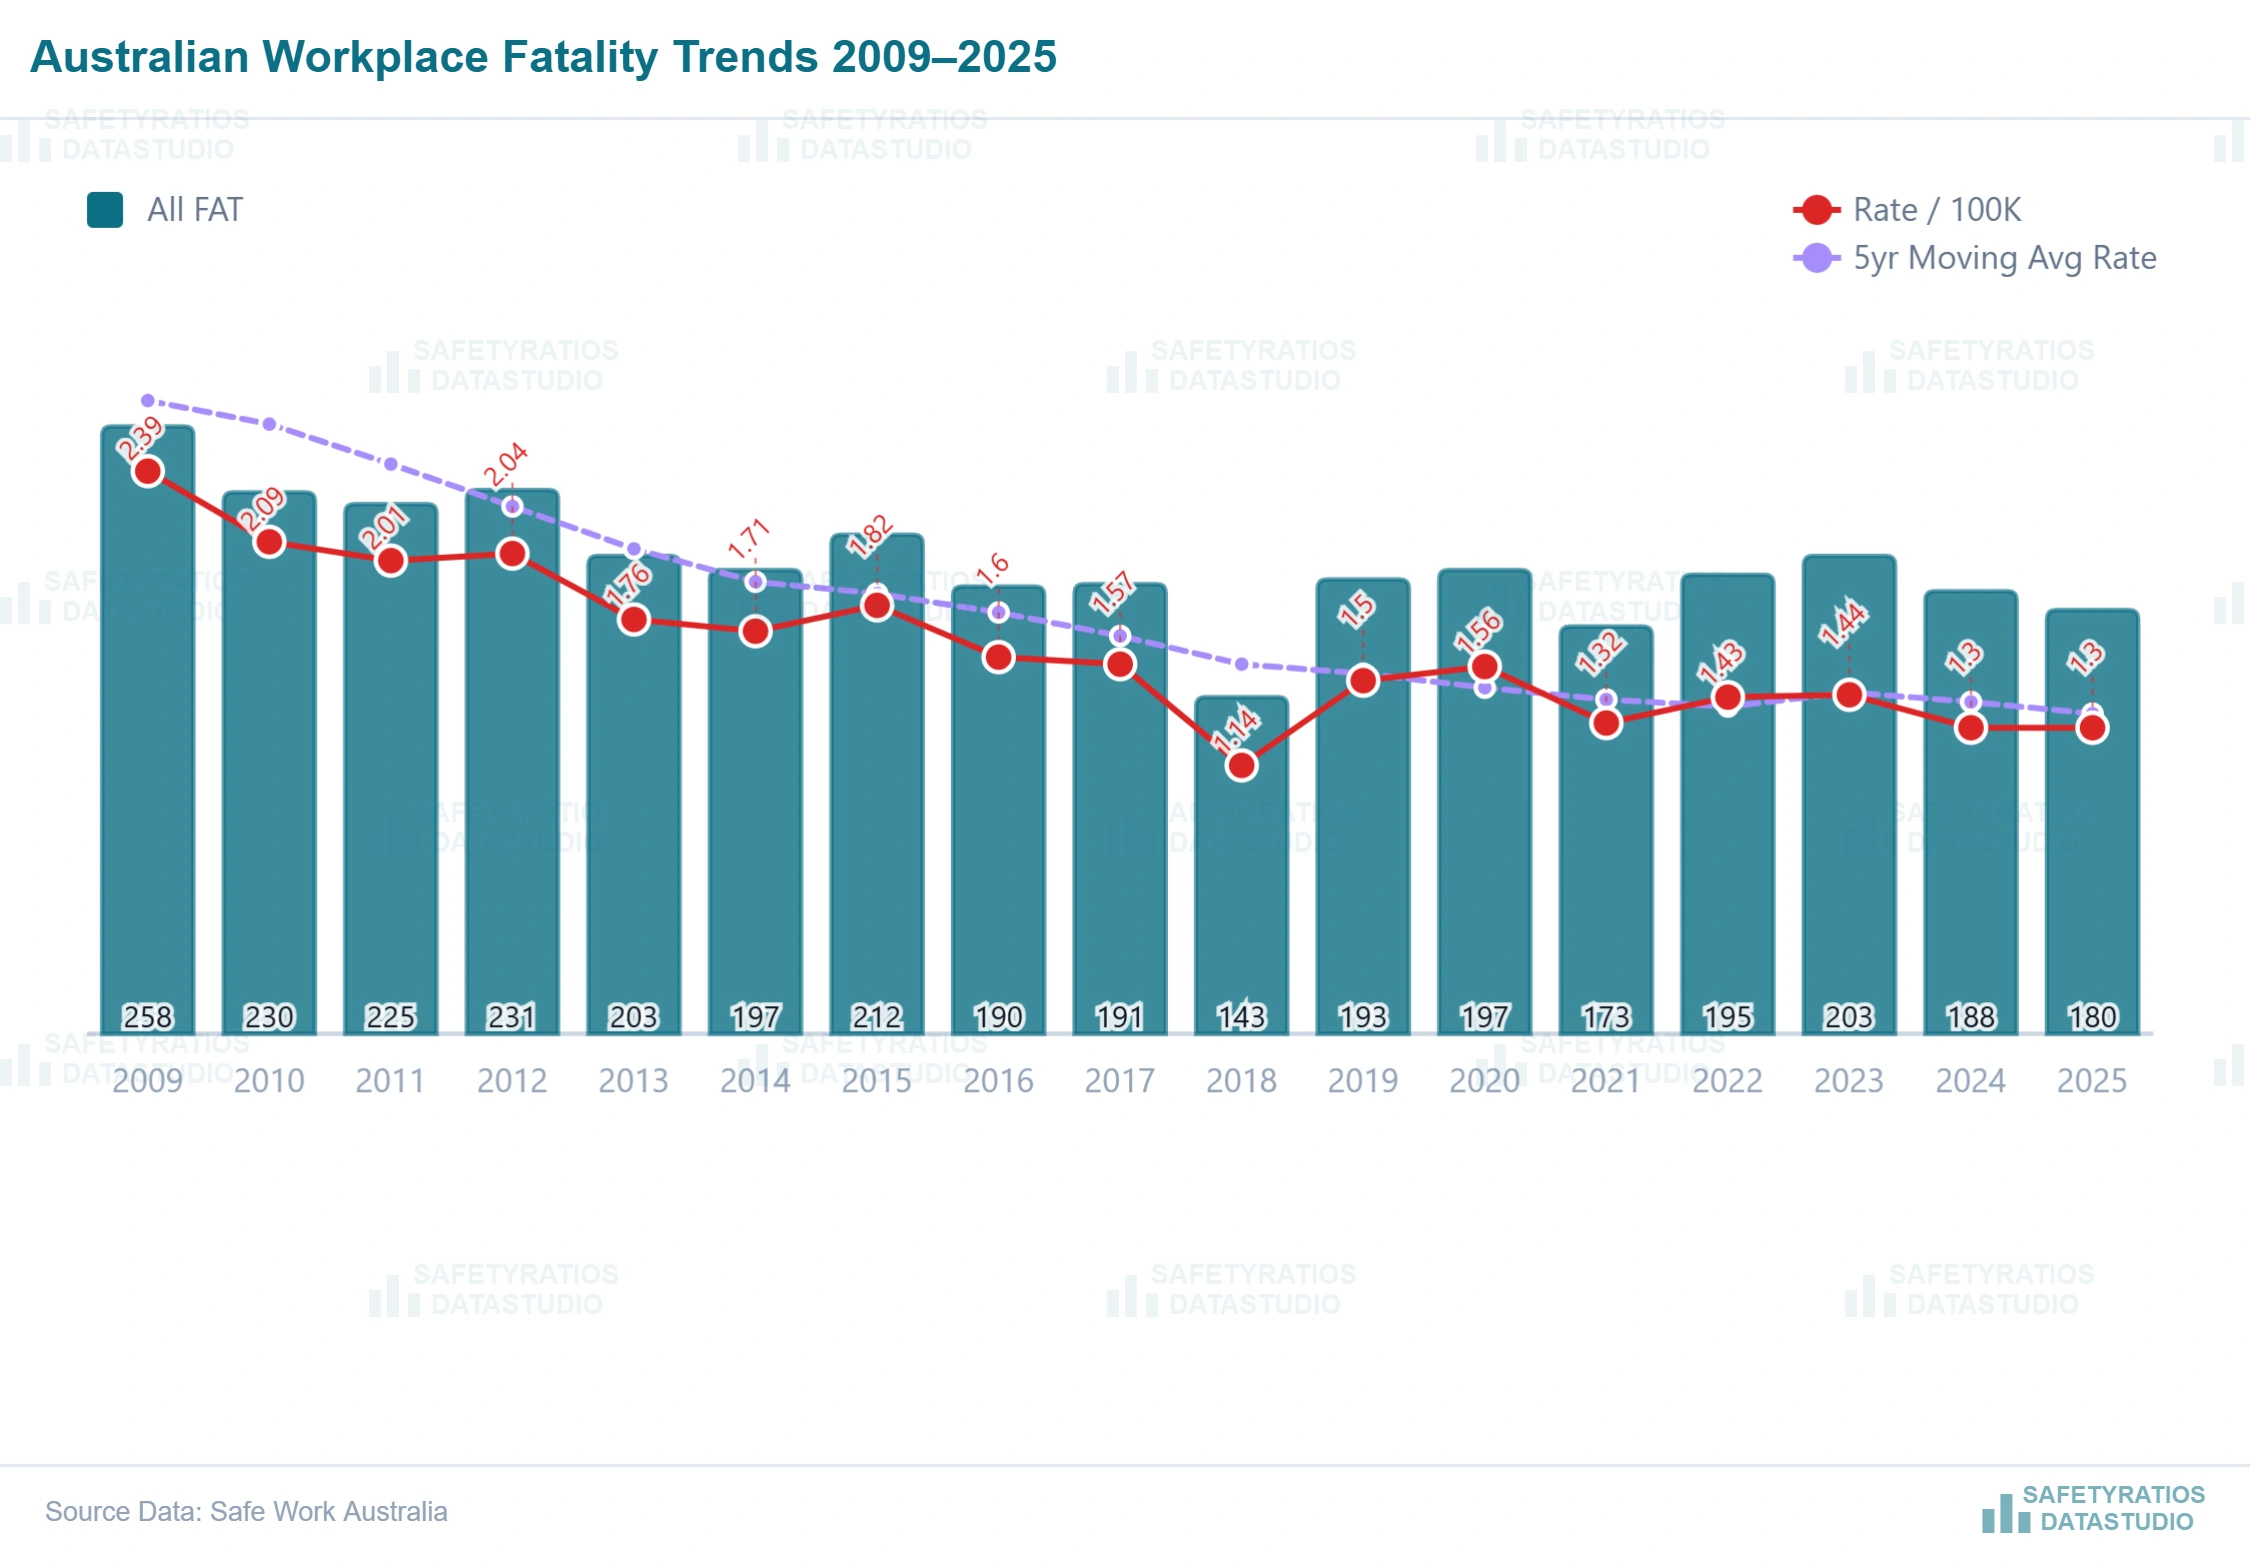
Australia has witnessed a consistent decrease in workplace fatality rates, dropping from 2.76 per 100,000 workers in 2003 to 1.76 in 2013, and further to 1.30 in 2025. This trend is notably different from that observed in some advanced economies, such as the UK and the US, where reductions in fatality rates have either plateaued over the last decade or remained stagnant throughout the past two decades.
Although the total fatalities of 180 for 2025 remains provisional and is lower than the 195 reported for 2022, the overall trend in both absolute number of fatalities and fatality rates is still moving steadily downward.
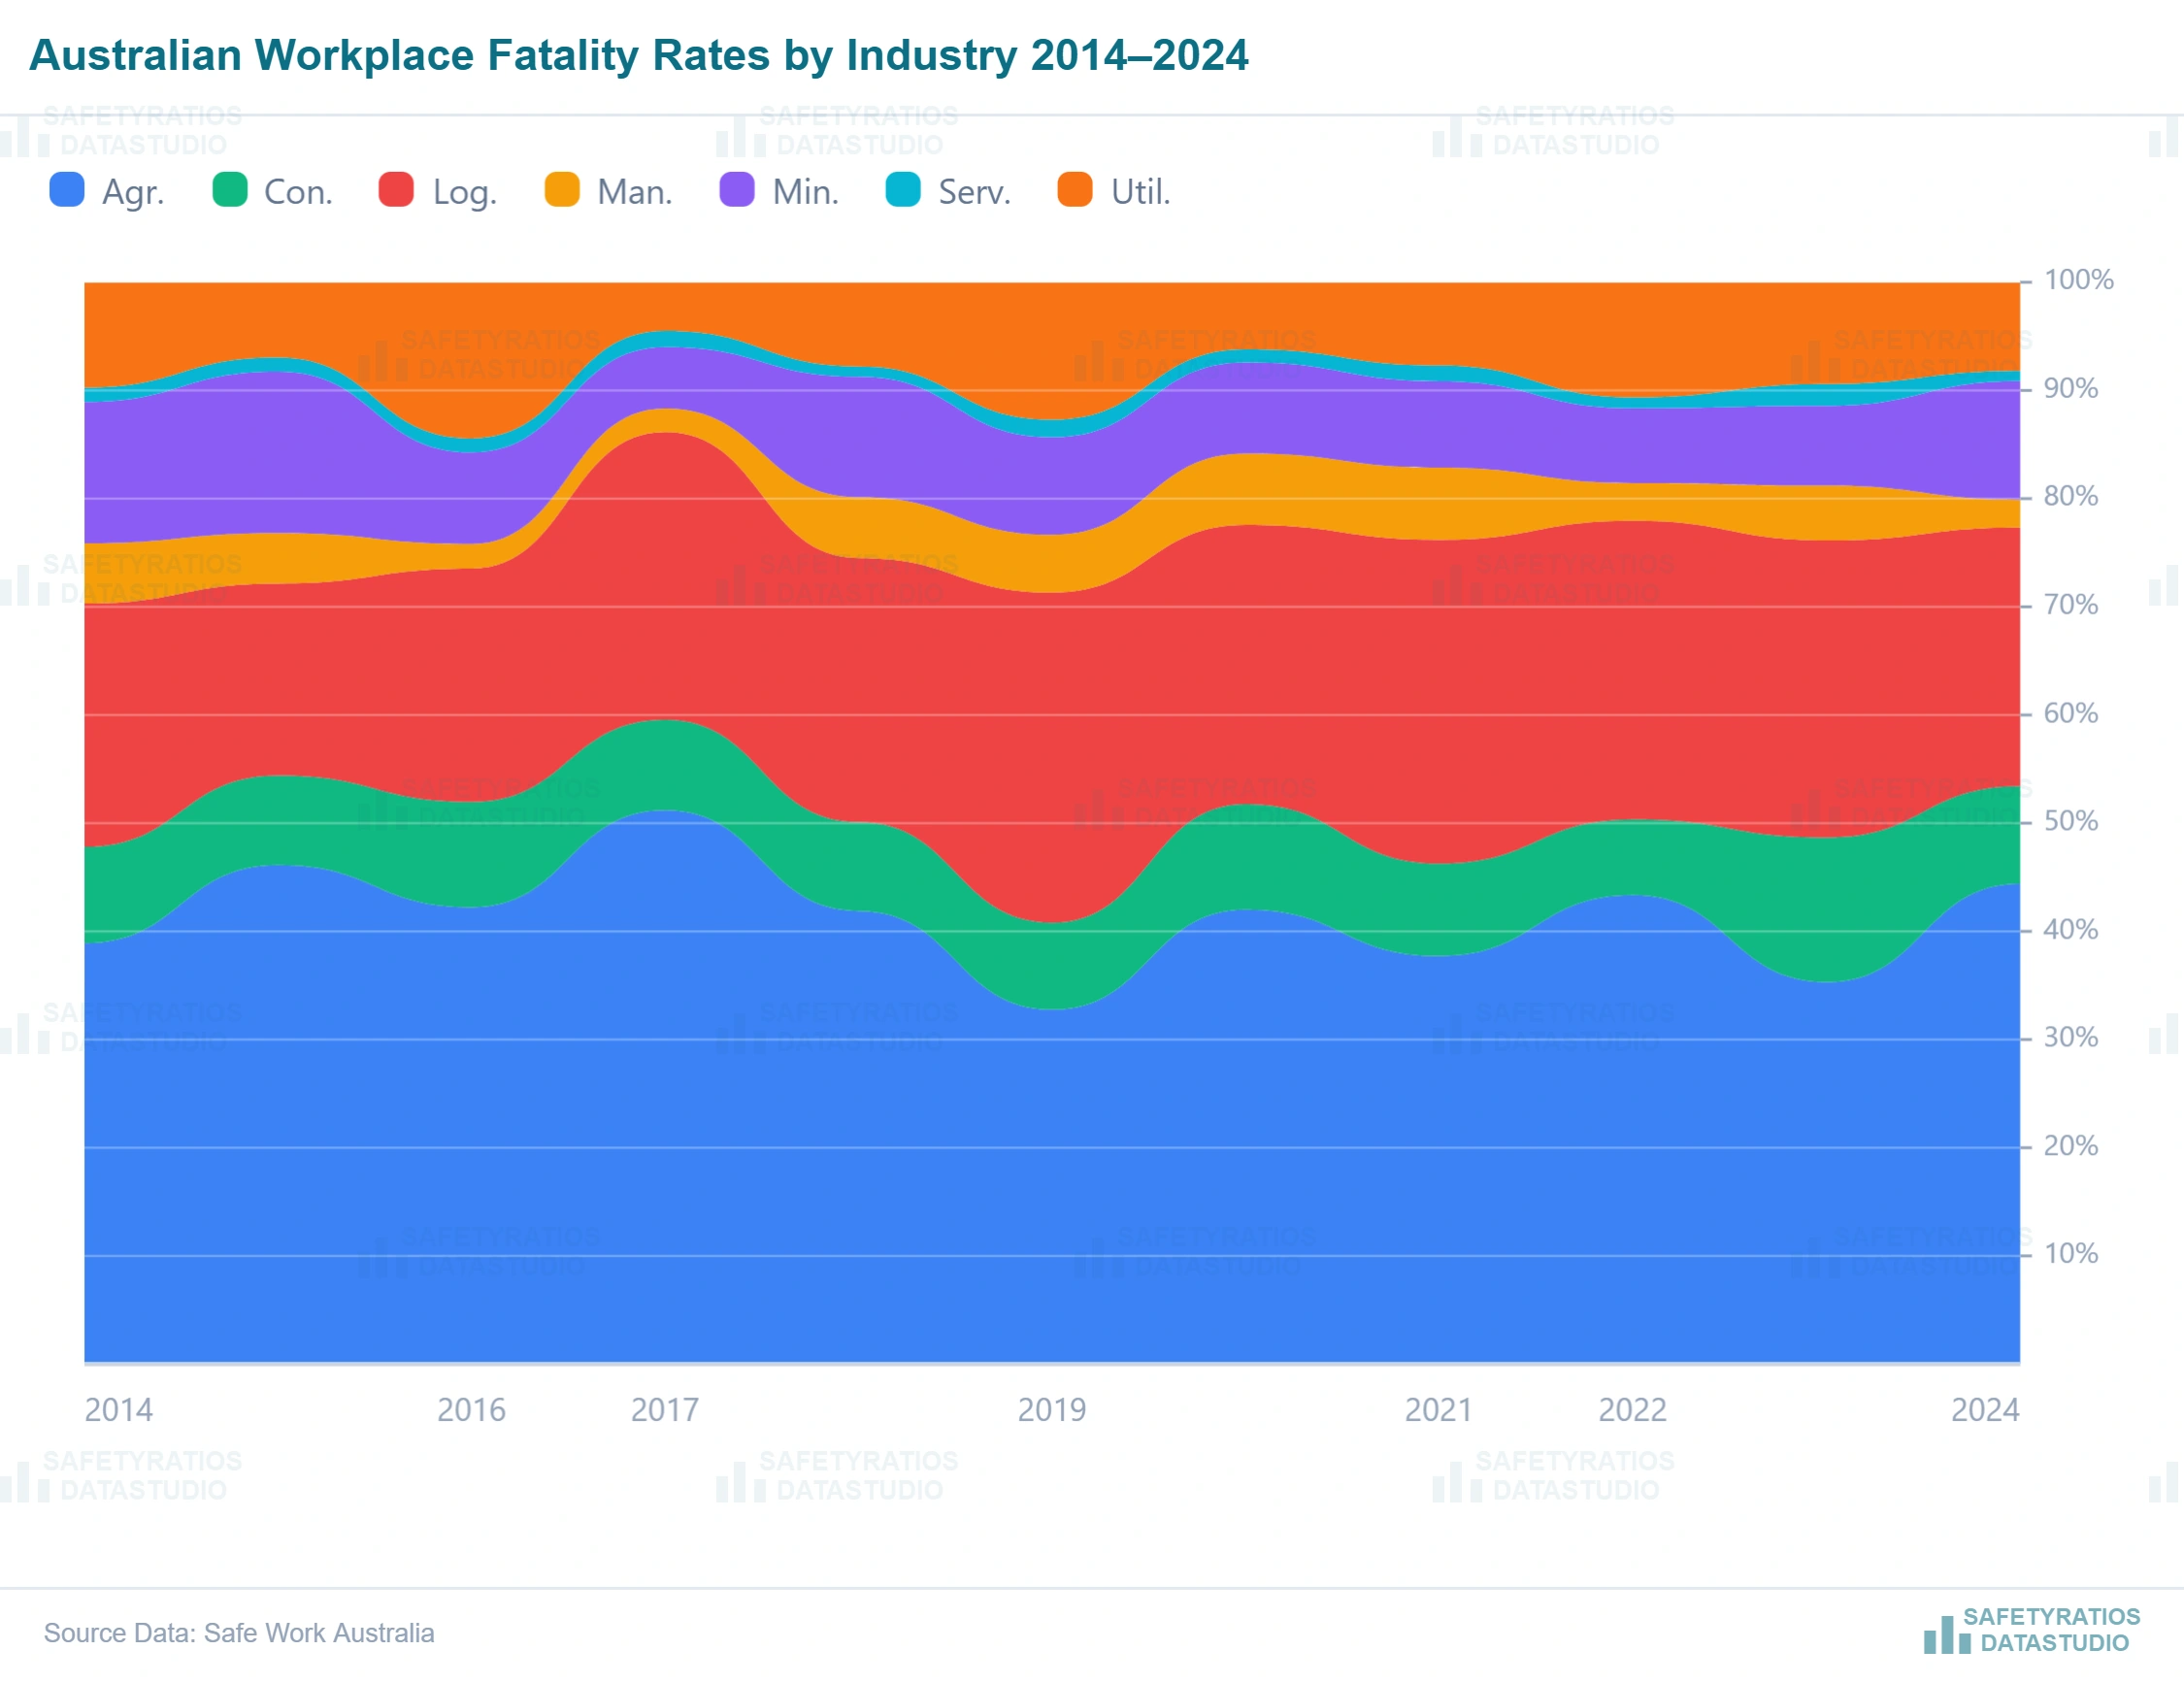
The updated numbers also make the article more specific. The national trend has improved, but the detailed 2024 figures still show concentration in transport and warehousing, agriculture, construction, and vehicle-related events.
A note on understanding statistics in reports
The famous phrase often attributed to Mark Twain, "lies, damned lies, and statistics," resonates when one delves into the interpretation of statistical reports. It is essential to acknowledge that statistical analyses rest upon various assumptions, some explicitly mentioned and others less apparent.
Fatality statistics, in particular, are subject to fluctuations influenced by global events, reporting practices, and the way each jurisdiction classifies workplace deaths. The latest national Australian series now runs to 2025, while the detailed sector and mechanism (cause) figures used here currently run to 2024. That difference matters when reading the national trend beside the more operational breakdown.
Moreover, the criteria for what is included in statistical datasets vary from one jurisdiction to another, rendering the comparison of national statistics difficult, and international comparisons even more so.
Both the absolute numbers and rates show a downward trend
In 2025, Australia recorded 180 workplace fatalities, equating to a fatality rate of 1.30 per 100,000 workers. This marks a notable decrease from earlier figures, including 231 fatalities in 2012 and the 2022 figure of 195 fatalities.
Over a span of more than two decades, the fatality rate has seen a significant reduction, going from 2.76 in 2003 to 1.30 in 2025.
This consistent decrease is visible in the national line, but the detailed sector data shows why the headline trend should not be read alone. The improvement is real, yet transport, agriculture, and construction continue to account for much of the latest detailed fatality burden.
Transportation: still a central risk
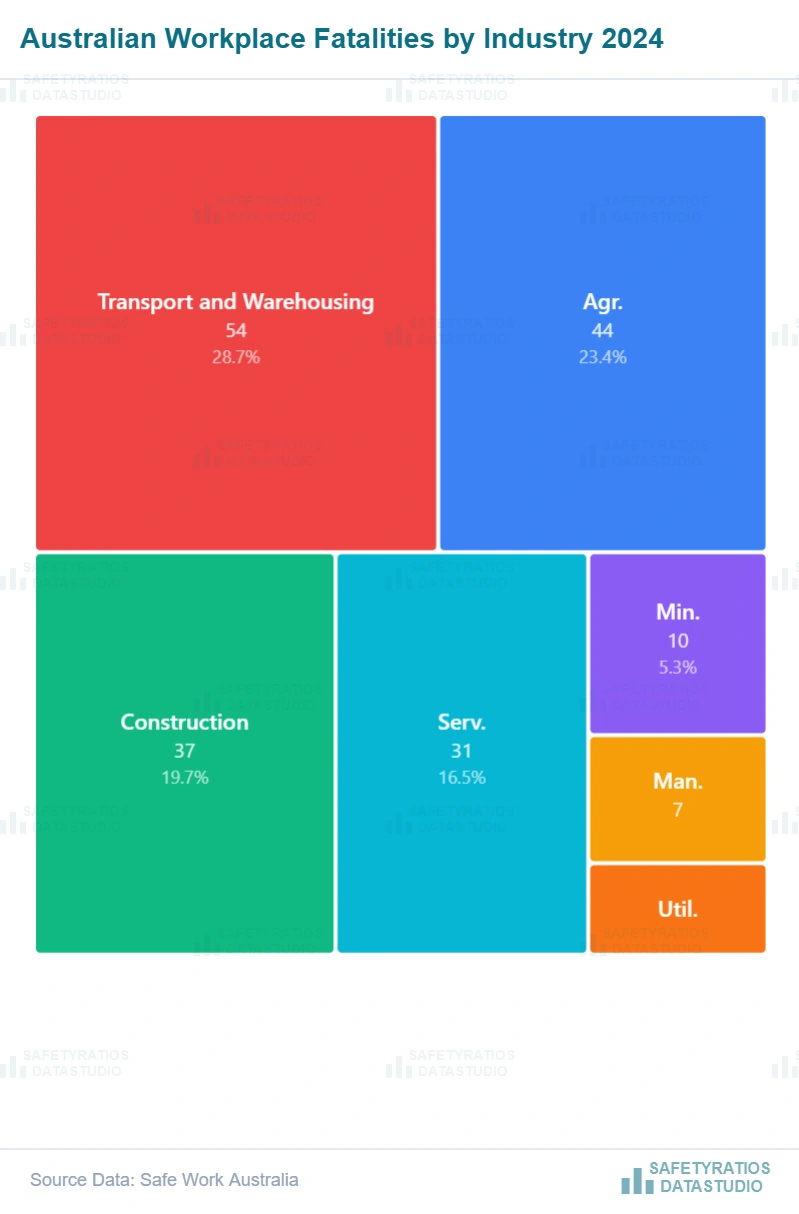
The transport and warehousing sector recorded 54 fatalities in 2024, the highest sector count in the detailed year. With a fatality rate of 7.39 per 100,000 workers, the sector remains one of the clearest signals in the Australian data.
The 2024 figure is lower than the 67 fatalities reported for transport, postal, and warehousing in 2022, but the sector remains prominent by both count and rate. It is therefore still a major contributor to national fatality statistics, even as the overall national rate continues to decline.
The updated data also points to the nature of the exposure. Transport and warehousing is not only a sector label. It is connected to work involving roads, vehicles, loading, unloading, route exposure, mobile work, and coordination beyond a fixed workplace.
Agriculture fatality rates: decreasing but persistently high
The Australian agriculture, forestry, and fishing sector reported 44 fatalities in 2024, maintaining its position as the sector with the highest workplace fatality rate in the detailed figures. The fatality rate for the year was 13.72 per 100,000 workers.
That rate is lower than the 14.66 per 100,000 workers reported for 2022, but agriculture remains a high-rate sector. The sector continues to stand out because its fatality burden is large relative to the size of its workforce.
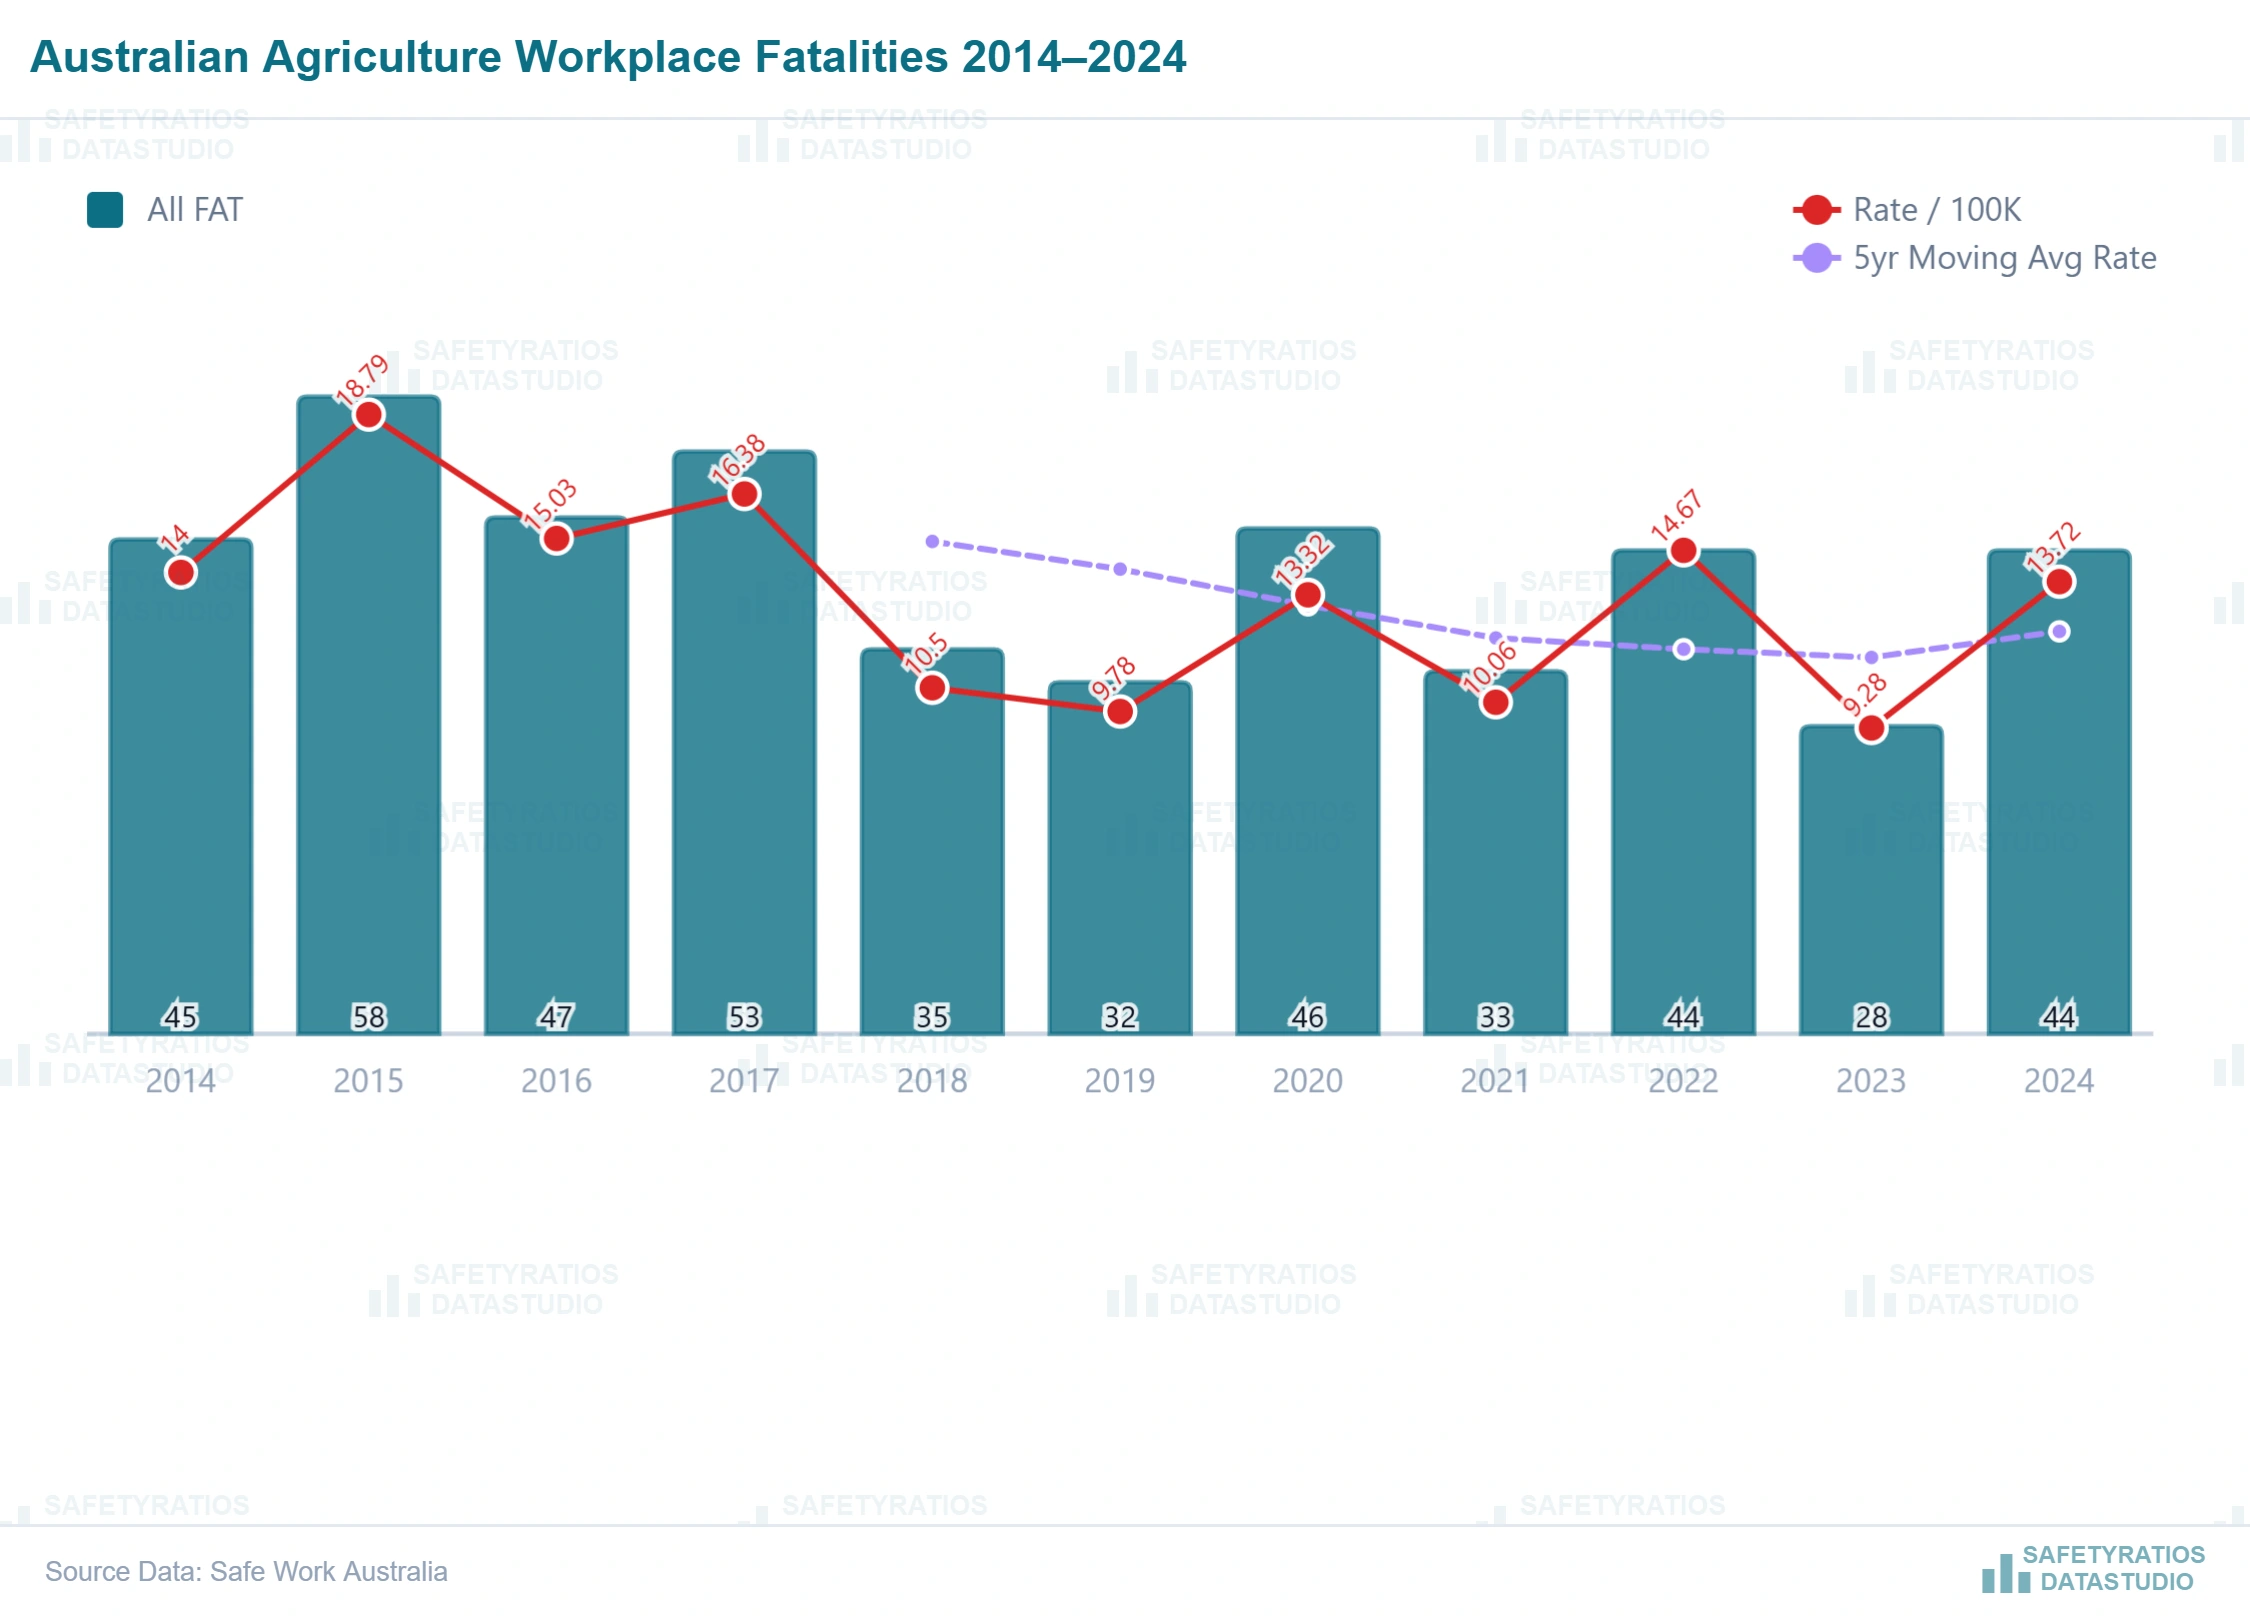
Despite long-term progress, agriculture still ranks as one of the most hazardous industries in the nation. The pattern remains consistent with the sector's exposure profile: mobile plant, remote work, animals, vehicles, seasonal pressure, and work that can be difficult to supervise in the same way as fixed-site activity.
Construction: a continuing challenge
In 2024, the Australian construction industry reported 37 workplace fatalities, translating to a fatality rate of 2.78 per 100,000 workers. This is higher than the 27 fatalities and 2.2 rate reported for 2022, although construction remains below agriculture and transport on the latest rate comparison.
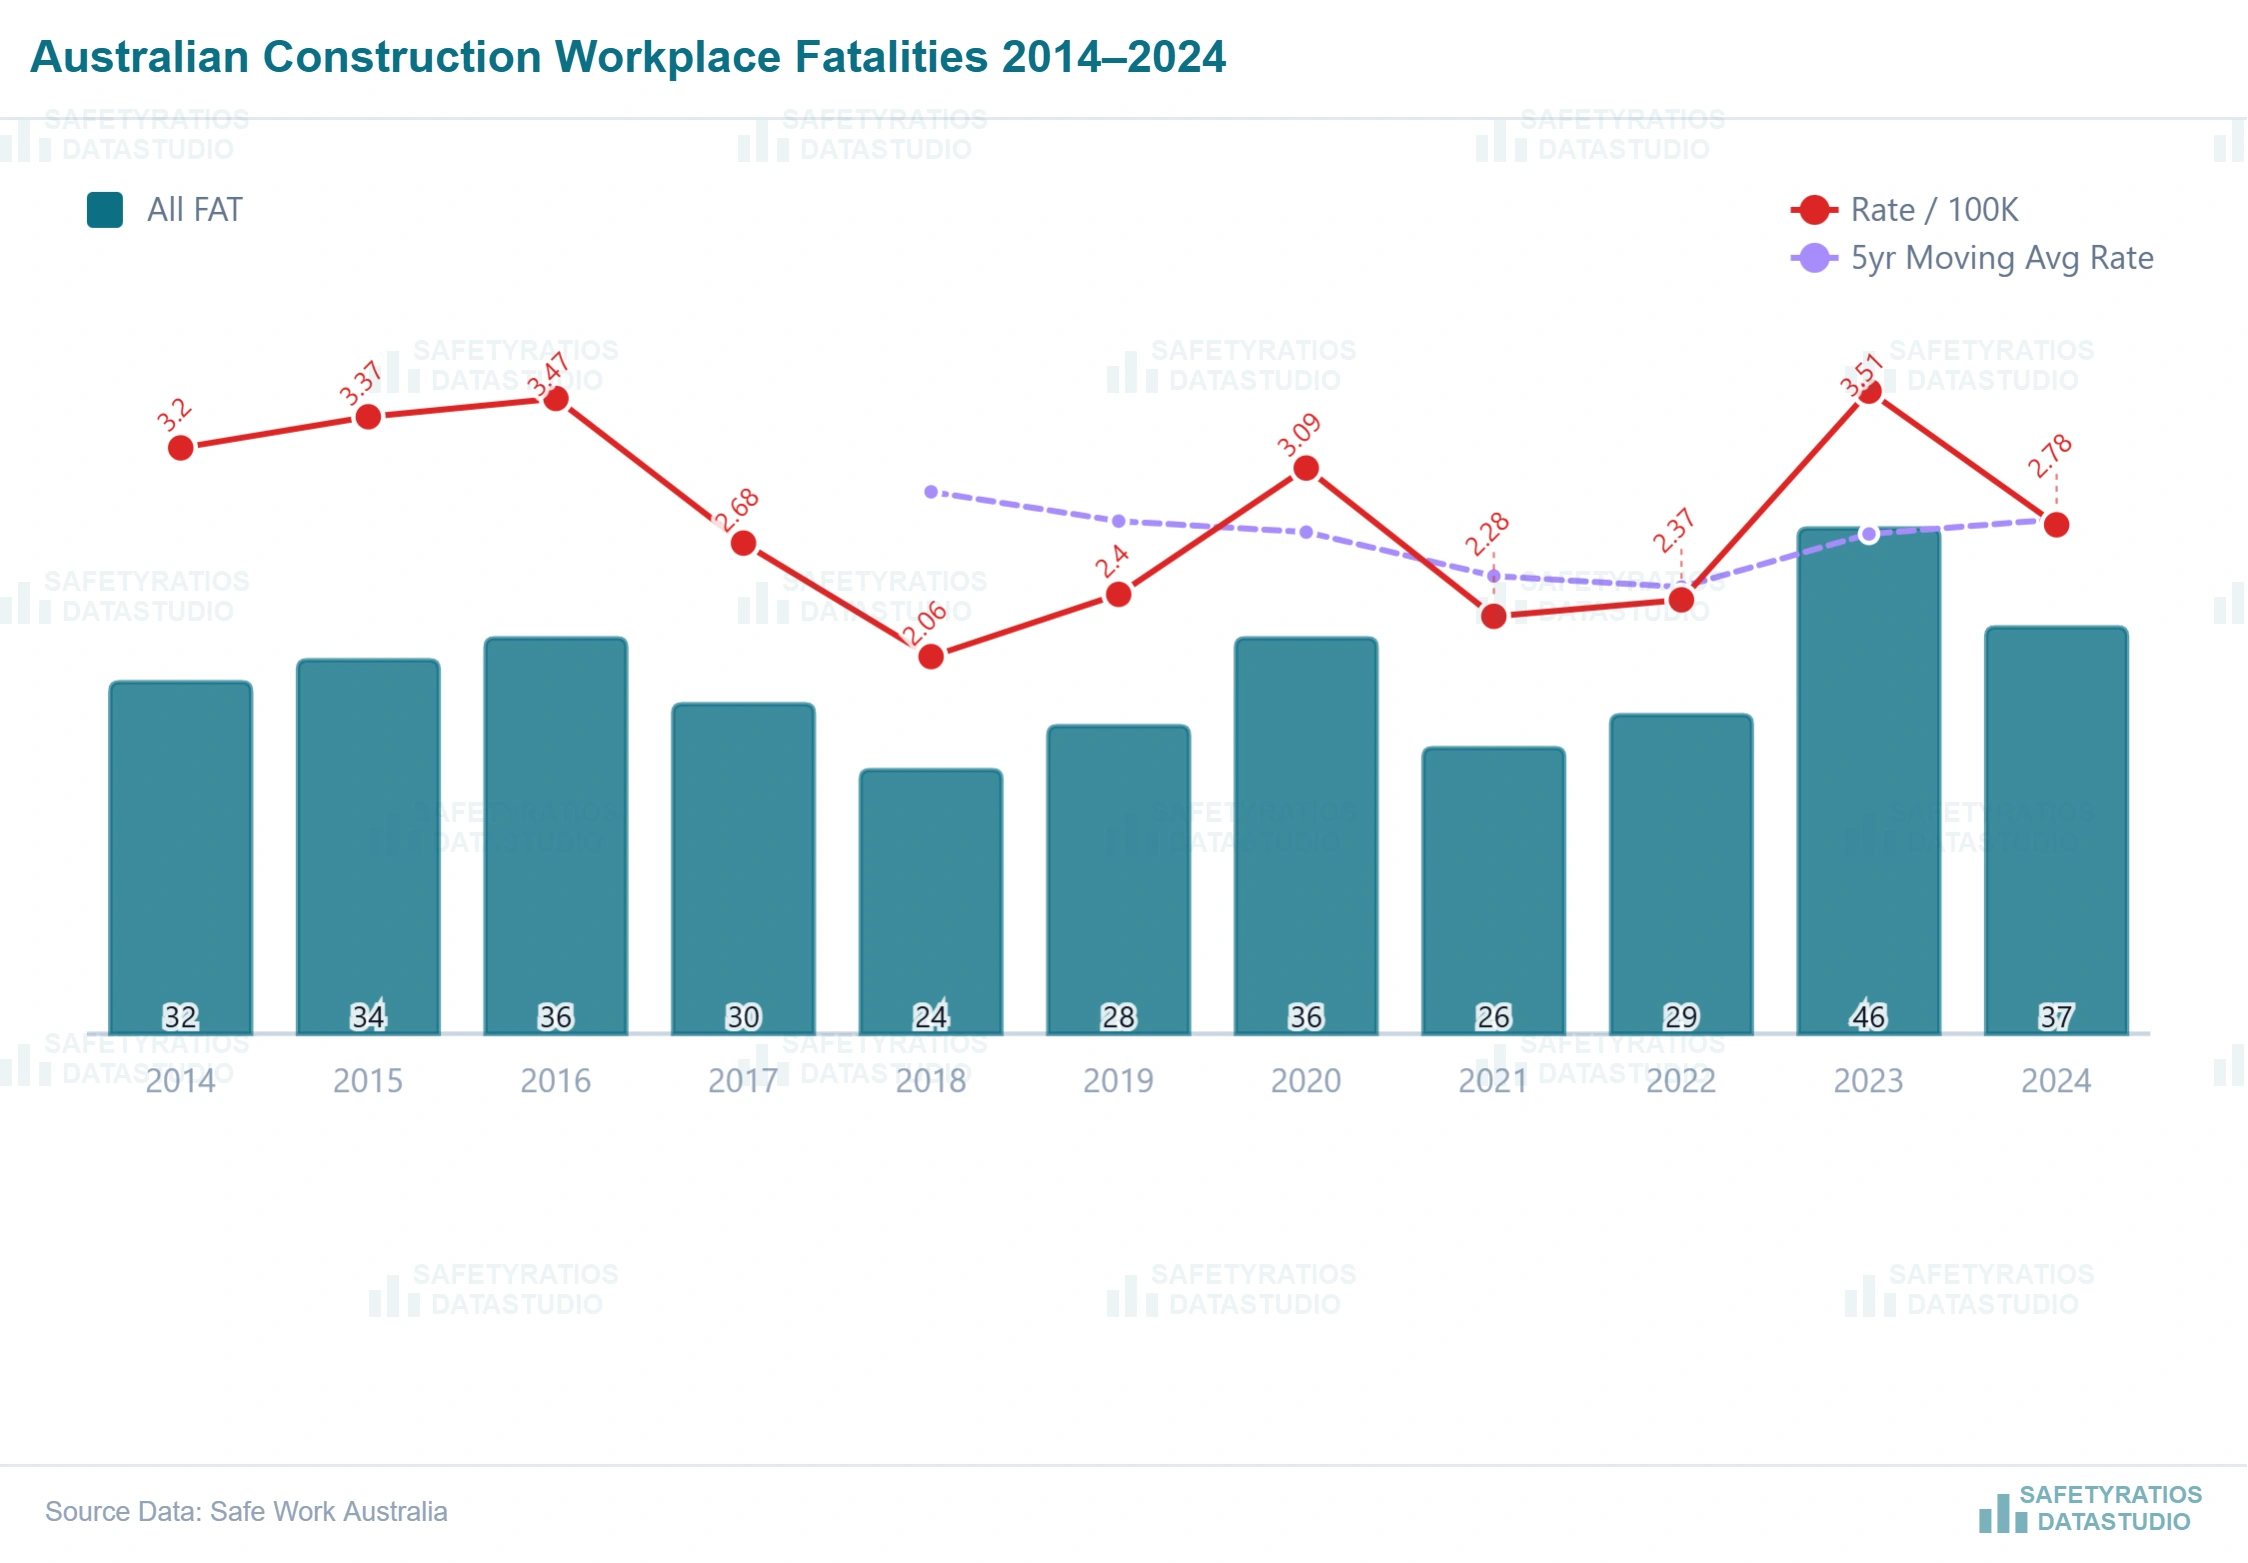
Construction's visibility in public discussion often reflects the nature of the work: temporary sites, changing phases, multiple contractors, lifting, access, temporary works, plant movement, and work at height. The updated figures suggest that the sector remains a significant part of the national picture even when it is not the highest-rate sector.
Fatality rates within construction should therefore be read with care. The sector has followed the broader long-term improvement seen across workplace fatalities, but the 2024 count shows why construction cannot be treated as a solved problem.
Vehicle and transport-related events remain the leading mechanism (cause)
Vehicle incidents accounted for 79 fatalities in 2024, making them the largest mechanism (cause) category in the Australian detailed figures. Falls from a height followed with 24 fatalities, hitting or being struck by moving objects accounted for 17, and being hit by falling objects accounted for 13.
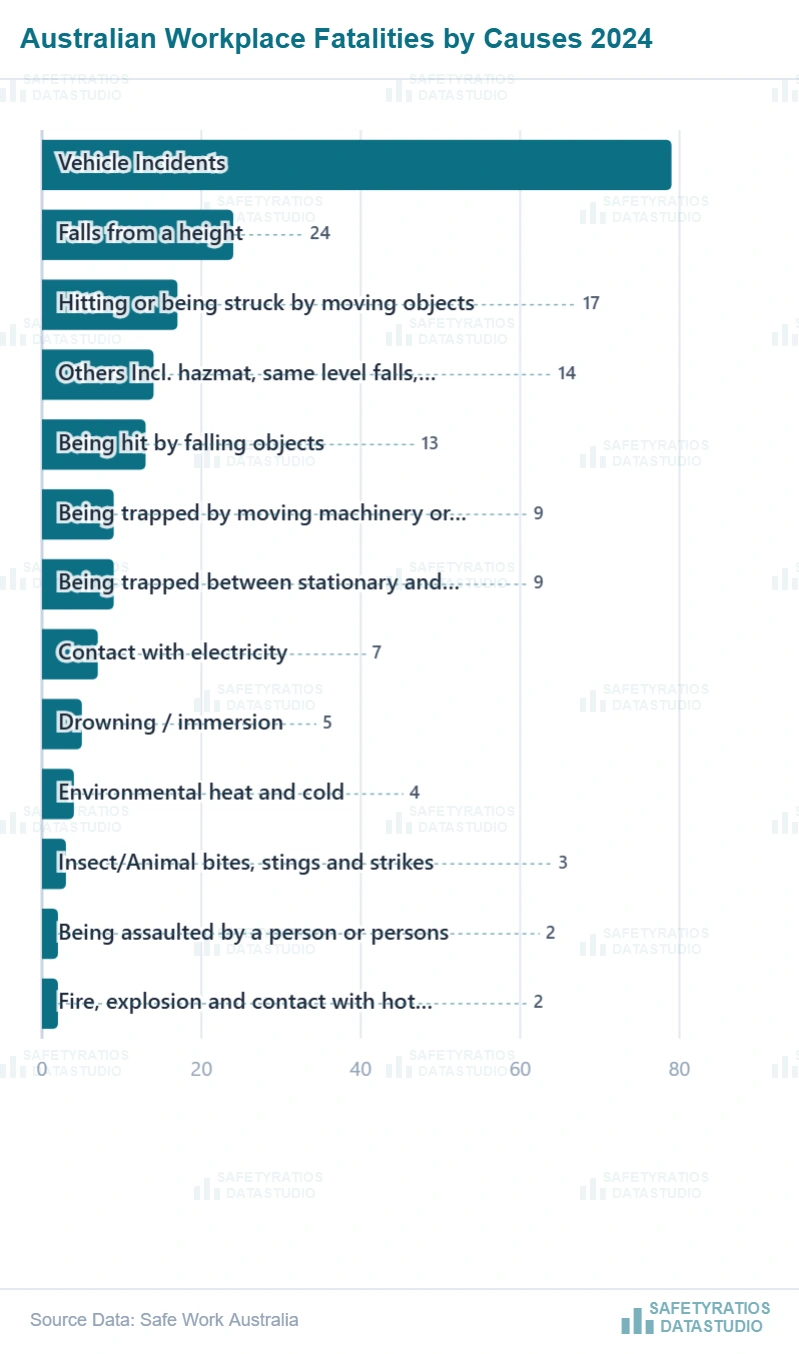
The number is lower than the 91 vehicle and transport-related fatalities reported for 2022, but it remains the dominant event type in the latest detailed data. That reinforces the same broad point made in the original article: vehicle and movement-related events are central to Australia's workplace fatality profile.
This pattern remains different from countries where falls from height form a larger share of the fatality picture. Australia's geography, transport networks, mobile work, and long-distance movement continue to make vehicle exposure an important part of the national safety story.
The data presented in this article are based on publicly available information and have been processed to highlight key trends. Yet they still lack the full metadata necessary for a deeper analysis of why transportation and vehicle-related events remain so significant for Australian workers.
At SafetyRatios, our goal is to use these trends to support better questions. The updated numbers do not replace investigation or sector-specific evidence, but they help show where attention should go next: transport and warehousing by count, agriculture by rate, construction as a major visible sector, and vehicle incidents as the leading mechanism (cause).
In closing, the national trend is encouraging, but the detailed figures show that the remaining fatality burden has a shape. Australia has improved over the long run, yet the concentration in particular sectors and event types remains the part of the story that deserves closer reading.
Frequently Asked Questions
How have Australian workplace fatalities changed over time?
Australia's workplace fatality rate has declined over the long run, from 2.76 per 100,000 workers in 2003 to 1.30 in 2025. The 2025 total and rate are still provisional, but they remain within the broad downward pattern shown over the period.
Which sector has the highest workplace fatality rate in Australia?
In the 2024 detailed sector figures, Agriculture, forestry, and fishing has the highest fatality rate at 13.72 fatalities per 100,000 workers.
Which sector recorded the most workplace fatalities in 2024?
Transport and warehousing recorded the highest sector count in 2024 with 54 fatalities, followed by Agriculture, forestry, and fishing with 44, and Construction with 37.
What event type accounts for the largest share of workplace fatalities?
Vehicle incidents are the largest national mechanism (cause) category in the 2024 detailed figures, accounting for 79 fatalities. Falls from a height, being struck by moving objects, and being hit by falling objects follow.
Why does the overall improvement not tell the full story?
The national fatality rate has improved, but the detailed figures show that fatalities remain concentrated in particular sectors and event types. The useful question is therefore not only whether fatalities are down, but where they remain concentrated.